The MWRA’s Industrial, Commercial and Institutional (ICI) Water Management Program was developed to help businesses, industries and institutions improve their water efficiency, thereby reducing operational costs. The Metropolitan Boston area and surrounding communities host one of the largest centers for health care and medical research in the country. Health care institutions are consistently within the top 10 water users in their communities and together make up one of the largest categories of users in the MWRA service area. Water and sewer costs averaged 22% of total utility costs in selected Boston area hospitals studied.
This report has been developed based on lessons learned from previously conducted, sector-specific water use surveys. During the early 1990s, the ICI program helped a variety of health care facilities, mainly hospitals, understand how increased awareness of water use and minor investments can have major impacts on water and sewer costs. Surveys conducted through the ICI program show a potential average reduction in annual water use of 19% per facility. Renovations of facility space and equipment replacement provide an opportunity for water conservation and significant reduction in operating costs in the competitive area of health care. This document provides information and a case study example demonstrating how implementation of water efficiency measures makes savings achievable.
Water and sewer rates, as well as cost/savings paybacks, are based on 1993/1994 figures. For context, water costs in 2020 are approximately 5.7 times the 1993 rate.
Typical Hospital Sector Information
Typical water use per capita in hospitals ranges from 40 gallons per day to 350 gallons per day. The allocation of water at a facility varies depending on the services provided, in-patient vs. out-patient visits, staff attendance, equipment used, age of the facility, and periodic maintenance practices followed. While there is tremendous variety among facilities, the ranges shown give an indication of most hospital's water use.
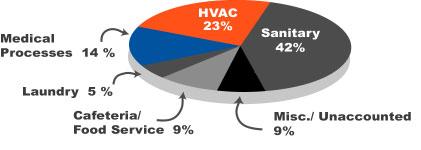
The graph below shows Average Water Use by Category at facilities studied. Facilities studied in the chart include hospitals with 138 to 550 bed capacities, in-patient admissions of 5,100 to 11,600 per year and annual water usage ranging from 15 to 67.2 million gallons. The 7 hospitals studied include: 1 large Boston, 1 large long-term care, 4 small community and 1 regional urban.

While conducting a water-use survey, it is beneficial to examine the different water used in each facility to determine high use areas. In hospitals, total water use can be divided among five major categories: sanitary, HVAC, medical processes, cafeteria and laundry services. The pie chart above illustrates the average percentage of total water use allocated to each of the categories.
Each category will have a typical range of consumption based on the services provided within the facility. Once these categories and percentages are organized into a readable chart, water efficiency measures (actions undertaken to save water), should be generated and compared to determine which measures offer the greatest potential savings or quickest paybacks.
Case Study: Norwood Hospital
This case study summarizes the steps one facility manager has taken for successful implementation of a Water Management Plan.
An illustration of the success of implementing water efficiency measures is demonstrated. The focus of this document is to offer a strategy to facility personnel who are considering initiation of a Water Management Plan. A Water Management Plan is developed by facility staff as an action program for efficient water use.
| NORWOOD HOSPITAL 1991 USE AND 1994 SAVINGS | |
|---|---|
Water Use in 1991: | 51.2 Million Gallons |
Water Use in 1994: | 36.6 Million Gallons |
Reduction in Use: | 29% |
