| Home |
| Water System |
| Sewer System |
| Harbor and Bay |
| School Program |
| About MWRA |
| Doing Business with MWRA |
| Contact MWRA |
Analysis of Lead Levels
From MWRA Communities Since 1997
Massachusetts Water Resources Authority
|
"90%" lead levels in sampled worst case homes have steadily dropped since 1992 due to MWRA's corrosion control treatment. One number does not tell the whole story.
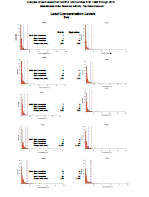
Below are graphs that show how lead levels have dropped over time, broken down by range of results. As you scan the graphs, you can see the number of positive results from stagnant samples from high risk homes drops since testing began in 1992.
The most recent sampling demonstrates that over 1/2 of these samples had no detectable lead. More than 4/5’s of these samples had levels less than 5 parts per billion. Over 95% of the samples were under 10 ppb. Only about 2.5% were over 15 ppb. Compare this to the first sampling in 1992 where over 40% of the samples were over 15 ppb, with nearly 20% over 50 ppb.
LEAD TEST RESULTS
Below are MWRA's lead testing results in first-flush samples, worst-case households.
|
In addition to looking at system wide results, MWRA staff look closely at the results at each home sampled. Seeing how results change at a particular home over time can yield additional information about what contributes to lead leaching. For example, MWRA staff noticed one home which had had very low levels for several years suddenly had high results. When we followed up with the homeowner, we discovered that the recent high results were from a newly renovated bathroom with a new brass faucet. Unfortunately, it is still possible to purchase brass faucets which can leach excessive amounts of lead.
More information on brass fixtures and lead
If you have questions or would like more information about lead in drinking water, please call our Water Quality Hotline: 617-242-5323, or email Beverly Anderson, Project Manager, Public Health.
Updated
February 9, 2024
Created 2006