| Home |
| About MWRA |
| Water System |
| Sewer System |
| Harbor and Bay |
| School Program |
| Doing Business with MWRA |
| Contact MWRA |
Water Use Case Study
Norwood Hospital - Norwood Massachusetts
Massachusetts
Water Resources Authority
|

The MWRA’s Industrial, Commercial and Institutional (ICI) Water Management Program was developed to help businesses, industries and institutions improve their water efficiency, thereby reducing operational costs. The Metropolitan Boston area and surrounding communities host one of the largest centers for health care and medical research in the country. Health care institutions are consistently within the top 10 water users in their communities and together make up one of the largest categories of users in the MWRA service area. Water and sewer costs averaged 22% of total utility costs in selected Boston area hospitals studied.
This report has been developed based on lessons learned from previously conducted, sector-specific water use surveys. During the early 1990s, the ICI program helped a variety of health care facilities, mainly hospitals, understand how increased awareness of water use and minor investments can have major impacts on water and sewer costs. Surveys conducted through the ICI program show a potential average reduction in annual water use of 19% per facility. Renovations of facility space and equipment replacement provide an opportunity for water conservation and significant reduction in operating costs in the competitive area of health care. This document provides information and a case study example demonstrating how implementation of water efficiency measures makes savings achievable.
Water and sewer rates, as well as cost/savings paybacks, are based on 1993/1994 figures. For context, water costs in 2020 are approximately 5.7 times the 1993 rate.
TYPICAL HOSPITAL SECTOR INFORMATION
Typical water use per capita in hospitals ranges from 40 gallons per day to 350 gallons per day. The allocation of water at a facility varies depending on the services provided, in-patient vs. out-patient visits, staff attendance, equipment used, age of the facility, and periodic maintenance practices followed. While there is tremendous variety among facilities, the ranges shown give an indication of most hospital's water use.
The graph below shows Average Water Use by Category at facilities studied. Facilities studied in the chart include hospitals with 138 to 550 bed capacities, in-patient admissions of 5,100 to 11,600 per year and annual water usage ranging from 15 to 67.2 million gallons. The 7 hospitals studied include: 1 large Boston, 1 large long-term care, 4 small community and 1 regional urban.
|
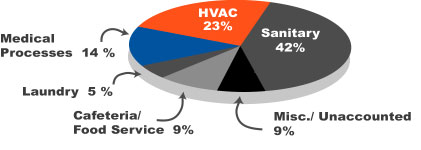
While conducting a water-use survey, it is beneficial to examine the different water used in each facility to determine high use areas. In hospitals, total water use can be divided among five major categories: sanitary, HVAC, medical processes, cafeteria and laundry services. The pie chart above illustrates the average percentage of total water use allocated to each of the categories.
Each category will have a typical range of consumption based on the services provided within the facility. Once these categories and percentages are organized into a readable chart, water efficiency measures (actions undertaken to save water), should be generated and compared to determine which measures offer the greatest potential savings or quickest paybacks.
CASE STUDY: NORWOOD HOSPITAL
This case study summarizes the steps one facility manager has taken for successful implementation of a Water Management Plan.
An illustration of the success of implementing water efficiency measures is demonstrated. The focus of this document is to offer a strategy to facility personnel who are considering initiation of a Water Management Plan. A Water Management Plan is developed by facility staff as an action program for efficient water use.
| NORWOOD HOSPITAL 1991 USE AND 1994 SAVINGS | |
|---|---|
Water Use in 1991: |
51.2 Million Gallons |
Water Use in 1994: |
36.6 Million Gallons |
Reduction in Use: |
29% |
MAJOR WATER EFFICIENCY MEASURES INITIATED BY FACILITY MANAGER AND IMPLEMENTED AT NORWOOD HOSPITAL:
- Elimination of seal and cooling water on medical air compressors and vacuum pumps. Water saved: 8.5 million gallons.
- Recirculating seal and cooling water for four vacuum pumps and one medical compressor as well as removing a vacuum pump that was not needed resulted in a net annual savings of 8.5 million gallons.
- Replacing the flush valves on toilets and urinals, and installing low-consumption aerators on all lavatory faucets resulted in a savings of 3 million gallons per year.
- Refrigeration system retrofit. Water saved: 2.1 million gallons per year.
Facility staff discovered the refrigeration system serving the morgue was cooled with once-through cooling water. In 1994 the system was replaced with an air-cooled unit, thereby eliminating 2.1 million gallons per year.
| NORWOOD HOSPITAL COST AND PAYBACK | |
|---|---|
Project cost |
$5,500 |
Annual savings |
$13,750 |
Payback time |
0.40 years |
In 1995 the MWRA's ICI Program completed a Water Management Survey for the Norwood Hospital offering additional water saving ideas:
Reducing the amount of water that is bled from the cooling tower would result in a savings of roughly 600,000 gallons per year. The chemical treatment vendor should be contacted to confirm that this will have no adverse effect on tower operation. Since this measure requires only the adjustment of the set point on the bleed-off controller there is no initial cost -- payback is immediate.
By incorporating an available retrofit system that collects, cools, pumps and recirculates the cooling water to the sterilizers, about 4 million gallons per year can be saved.
STEPS FOR IMPLENTING THE WATER MANAGMENT PLAN
The following steps proved successful in implementing the water management plan at Norwood Hospital.
1. Develop Water Management Plan
- Investigate current water uses and categorize (as shown in pie chart above).
- Estimate the water used in general categories. Identify measures through independent research and solicit water savings and cost information from different sources: professional associations, trade groups, vendors, MWRA.
- Set goals. Prioritize measures to implement depending on capital budgets, paybacks, percentage reductions, cost-benefit analysis.
2. Present Administration & Finance
- Make detailed proposals of projects to administrators illustrating required payback period (1 year or less in the case of Norwood Hospital) to establish plan.
- Involve financial leaders first; show vendor quotes, contractor bids, man hours and scheduling of projects and when savings are expected.
- Indicate that savings realized from water efficiency measures can be directed back to fund more projects related to water conservation measures.
3. Implement the plan
- Prioritize projects - do major projects with significant savings first, use savings to fund future projects and prove credibility of plan.
- Educate staff on individual responsibilities.
- Make an ongoing commitment to continuous improvement, monitor savings, continue to track water use; avoid complacency, stay aggressive, don't be satisfied.
Updated September 3, 2020
PDF files on this site require Adobe Acrobat Reader® (free download)