| Home |
| Water System |
| Sewer System |
| Harbor and Bay |
| School Program |
| About MWRA |
| Doing Business with MWRA |
| Contact MWRA |
MWRA's Drinking Water Test Results for 2008
Massachusetts Water Resources Authority
FOR METRO BOSTON/METRO WEST COMMUNTIES
2008 Results (published in June, 2009)
|
This report is required under the federal Safe Drinking Water Act Public Law 104-12, Section 1414 (C), PWS ID #6000000.
This report describes how we treat, test and deliver tap water to your home.
The Massachusetts Water Resources Authority and your local water department test up to 500 samples each week, and test for over 120 contaminants each year.
This report includes the results of those tests for 2008.
A MESSAGE FROM MWRA EXECUTIVE DIRECTOR FRED LASKEY
Dear Customer, The Massachusetts Water Resources Authority is pleased to send you this year’s annual report on your drinking water quality. MWRA and your local water department test thousands of water samples each week, under strict federal and state guidelines. The results for 2008 are excellent: for the 120 contaminants we test for, every standard was met. I am also pleased to report that the lead results for 2008 and the first half of 2009 show that system-wide, MWRA was below the federal Lead Action Level. It is important to remember that lead is not in the source water, but can enter the water through some household plumbing that contains lead. Recent tests have also shown that there are no traces of pharmaceuticals in MWRA water. Your tap water is one of the best values around. For less than a penny a gallon, you receive some of the cleanest, best tasting drinking water in the country. That penny also provides you with experienced, professional staff who protect, treat and deliver your water and make sure it is always available. MWRA has great confidence in the water we deliver to your home, and we want you to have the same confidence. This report contains important information, and I hope you can take a moment to read through it. Please contact us if you have any questions or comments about your water quality, or any of MWRA's programs. Sincerely, |
WHERE DOES YOUR WATER COME FROM?
|
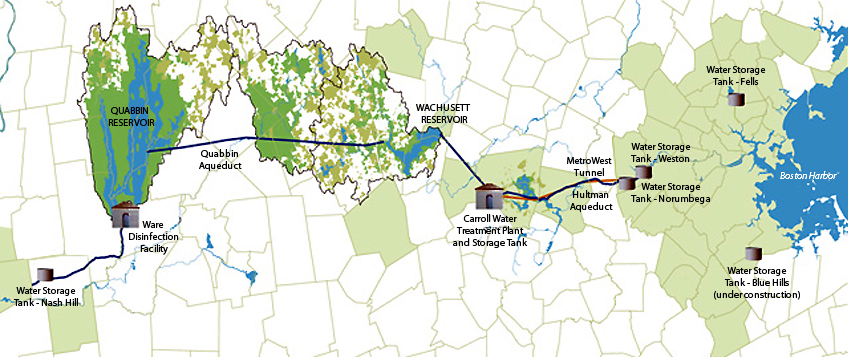
Your water comes from the Quabbin Reservoir, about 65 miles west of Boston, and the Wachusett Reservoir, about 35 miles west of Boston. These reservoirs supply wholesale water to local water departments in 50 communities, 44 in greater Boston and MetroWest, three in western Massachusetts, and serves as a back-up supply for three others. The two reservoirs combined supplied about 206 million gallons a day of high quality water to consumers in 2008.
Quabbin and Wachusett watersheds are protected naturally with over 85% of the watersheds covered in forest and wetlands. About 75% of the total watershed land cannot be built on. The natural undeveloped watersheds help to keep MWRA water clean and clear. Also, to ensure safety, the streams and the reservoirs are tested
often and patrolled daily by the Department of Conservation and Recreation (DCR).
Rain and snow falling on the watersheds - protected land around the reservoirs - turn into streams that flow to the reservoirs. This water comes in contact with soil, rock, plants, and other material as it follows its natural path to the reservoirs.
While this process helps to clean the water, it can also dissolve and carry very small amounts of material into the reservoir. Minerals from soil and rock do not typically cause problems in the water. But, water can also transport contaminants from human and animal activity. These can include bacteria, viruses, and fertilizers - some of which can cause illness. The test data in this report show
that these contaminants are not a problem in your reservoirs' watersheds.
The Department of Environmental Protection (DEP) has prepared a Source Water Assessment Program report for the Quabbin and Wachusett
Reservoirs. The DEP report commends DCR and MWRA on the existing source protection plans, and states that our “watershed protection programs are very successful and greatly reduce the actual risk of contamination.” The report
recommends that we maintain present watershed plans and continue to work with the residents, farmers, and other interested parties to maintain the pristine watershed areas.
MAP OF THE MWRA WATER SYSTEM
MWRA WATER SYSTEM |
|---|
|
HOW YOUR WATER IS TREATED
From the Reservoir to Your Home - Water Treatment Steps
The water you drink is treated at the John J. Carroll Water Treatment Plant in Marlborough. The first treatment step is disinfection of reservoir water. MWRA’s licensed treatment operators carefully add measured doses of ozone gas bubbles to the water to kill any pathogens (germs) that may be present in the water.
Fluoride is then added to reduce cavities. Next, the water chemistry is adjusted to reduce corrosion of lead and copper from home plumbing Last, we add
monochloramine, a mild and long-lasting disinfectant combining chlorine and ammonia, which protects the water while it is in the local pipelines.
IMPROVEMENTS TO THE WATER SYSTEM
MWRA’s Improvements to the Water Supply
Over the last ten years, in addition to the
treatment plant, MWRA has improved watershed protection, built the MetroWest tunnel, installed covered storage tanks, and rehabbed many miles of pipeline. These projects are the largest investments since the construction of the Quabbin Reservoir in the 1930s.
MWRA and its partner communities will continue to make necessary improvements to ensure high quality water is delivered directly to the customer’s tap. One high priority is rehabbing older pipes within the extensive pipe network. MWRA is upgrading its own pipes, as well as providing zero-interest loans to help communities improve their older pipes. To save money and limit traffic and
service disruptions, construction crews try to clean and reline rather than replace pipes whenever possible.
WATER CONSERVATION
On average, each person uses about 65 gallons of water each day. There are many simple ways you can conserve water and lower your bills, including: fixing leaks, installing low-flush toilets and low-flow shower heads, or minimizing
your outdoor watering. MWRA has an active conservation program, and it is paying off.
Demand has dropped dramatically and water usage is lower than it has been in over 40 years. Still, there is more work to be done to conserve this precious resource. To find out more, contact the MWRA at 617-242-SAVE or visit our web site for tips on saving water indoors and in your backyard.
TEST RESULTS
Tests Before Treatment
We test the water as it leaves the reservoir to see how well protected our watersheds are. Test results show few contaminants are found in the reservoir. The few that are found are in very small amounts, well below EPA’s standards. Turbidity (or cloudiness of water) is one measure of overall water quality. Typical levels at the Wachusett Reservoir are 0.3 NTU (Nephelometric Turbidity Units). In 2008, turbidity was always below EPA’s standard of 5.0 NTU. It was also below the stricter Massachusetts standard of 1.0 NTU over 99.99% of this time, with the highest level at 1.17 NTU. This did not interfere with effective disinfection. MWRA also tests reservoir water for pathogens – such as fecal coliform, bacteria, viruses, Cryptosporidium, and Giardia. They can enter the water from animal or human waste. All test results were well within state and federal testing and treatment standards.
Tests in Community Pipes
MWRA and local water departments test 300 to 500 water samples each week for total coliform bacteria. Total coliform bacteria can come from the intestines of warm-blooded animals, or can be found in soil, plants, or other places. Most of the time, these bacteria are not harmful. However, their presence could signal that harmful bacteria from fecal waste may be there as well. The EPA requires that no more than 5% of the samples in a month may be positive for total coliform. If a water sample tests positive for total coliform, we run more specific tests for E.coli. E.coli is a bacteria found in human and animal fecal waste and may cause illness.
|
||||||||||||||||||||||||||||||||||||||||||||||||
Tests After Treatment
EPA and state regulations also require many water quality tests after treatment to check the water you are drinking. MWRA conducts tens of thousands of tests per year on over 120 contaminants. The bottom line is that the water quality is excellent. All of the levels are below EPA’s allowable limits. A complete list of potential contaminants that we test for is posted on our website.
|
||||||||||||||||||||||||||||||||||||||||||||||||||||||||||||||||||||||||||||||||||||||||
MWRA water is lead-free when it leaves the reservoirs. MWRA and local pipes that carry the water to your community are made mostly of iron and steel and do not add lead to the water.
However, lead can get into tap water through pipes in your home, your lead service line, lead solder used in plumbing, and some brass fixtures.
Corrosion or wearing away of lead-based materials can add lead to tap water, especially if water sits for a long time in the pipes before it is used.
What is MWRA doing to lower levels? What can I do?
In 1996, MWRA began adding sodium carbonate and carbon dioxide to adjust the water's pH and buffering capacity. This change has made the water less corrosive, thereby reducing the leaching of lead into drinking water. Lead levels found in sample tests of tap water have dropped by over 80 percent since this treatment
change. Local water departments are working to decrease lead corrosion by replacing existing lead service lines. Also, MWRA is working with city and state governments to get rid of lead in all new household plumbing, in particular
faucets. Federal law still allows new faucets to contain as much as 8% lead.
To further decrease your potential exposure, you should always use cold, fresh running water for drinking or cooking and buy plumbing fixtures that have no or low lead levels. Read the labels of any new plumbing fixture closely.
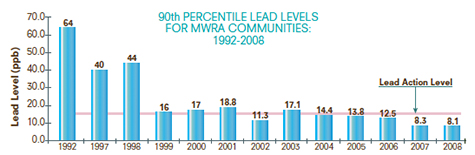
MWRA Meets Lead Standard in 2008
Under EPA rules, each year MWRA and your local water department must test tap water in a sample of homes that are likely to have high lead levels. These are usually homes with lead service lines or lead solder. The EPA rule requires that 9 out of 10, or 90%, of the sampled homes must have lead levels below the Action Level of 15 parts per billion (ppb).
Lead levels in sampled worst case homes have dramatically dropped since 1992. Over the last several years, the results have been below the EPA standard, including the last 10 sampling rounds. Results for September 2008 are shown in the table. 9 of 10 houses were below 8.1 ppb, which is below the Action Level of 15 ppb. Some communities had more than one home test above the Action Level. If you live in one of these communities, your town letter will provide you with more information.
SEPTEMBER 2008 LEAD AND COPPER RESULTS |
||||||||||
|---|---|---|---|---|---|---|---|---|---|---|
| Lead | Range
|
90% Value
|
(Target) Action Level |
(Ideal Goal) MCLG |
# Homes above AL/# Homes Tested |
|||||
1.2 - 39.9 ppb |
8.1 ppb
|
15 ppb |
0 |
12/450 |
||||||
| Copper | 0.003-0.44 ppm |
0.11 ppm
|
1.3 ppm |
0 |
0/450 |
|||||
AL=Action Level-The concentration of a contaminant which, if exceeded, triggers treatment or other requirements which a water system must follow. MCLG=Maximum Contaminant Level Goal The level of contaminant in drinking water below which there is no known or expected risk to health. MCLGs allow for a margin of safety. |
||||||||||
What can I do to reduce exposure to lead in drinking water?
- Run the tap until after the water feels cold. To save water, fill a pitcher with fresh water and place in the refrigerator for future use.
- Never use hot water from the faucet for drinking or cooking - especially when making baby formula or other food for infants.
- Ask your local water department if there are lead service lines leading to your home.
- Test your tap water. Call the MWRA Drinking Water Hotline (617-242-5323) or visit our website for more tips and a list of DEP certified labs that can test your water.
- Call the Department of Public Health at 1-800-532-9571 or EPA at 1-800-424-LEAD for health information.
90th PERCENTILE LEAD LEVELS FOR MWRA COMMUNITIES: 1992-2008 |
|---|
 |
Important Information from EPA about Lead
If present, elevated levels of lead can cause serious health problems, especially for pregnant women and young children. Lead in drinking water is primarily from materials and components associated with service lines and home plumbing. MWRA is responsible for providing high quality drinking water, but cannot control the variety of materials used in plumbing components. If your water has been sitting for several hours, you can minimize the potential for lead exposure by flushing your tap for 30 seconds to 2 minutes before using water for drinking or cooking. If you are concerned about lead in your water, you may wish to have your water tested. Information on lead in drinking water, testing methods, and steps you can take to minimize exposure is available from the Safe Drinking Water Hotline at 1-800-426-4791 or www.epa.gov/safewater/lead.
IMPORTANT INFORMATION FROM EPA AND DEP
|
Contaminants in Bottled Water and Tap water
Drinking water, including bottled water, may reasonably be expected to contain at least small amounts of some contaminants.The presence of contaminants does not necessarily indicate that water poses a health risk. More information about contaminants and potential health effects can be obtained by calling the EPA’s Safe Drinking Water Hotline (1-800-426-4791) or MWRA.
In order to ensure that tap water is safe to drink, the Massachusetts DEP and EPA prescribe regulations which limit the amount of certain contaminants in water provided by public water systems. Food and Drug Administration (FDA) and the Massachusetts Department of Public Health regulations establish limits for contaminants in bottled water which must provide the same protection for public health.
Research and New Regulations
MWRA has been working with EPA and other researchers to define new national drinking water standards by testing for contaminants that are not regulated. Our results will be used with those of other water suppliers to help EPA set regulations if they are necessary. MWRA is also participating with Tufts University on a nationally-funded study testing for Cryptosporidium and Giardia.
ONGOING RESEARCH FOR NEW REGULATIONS |
||
|---|---|---|
| Test | Measurement Units |
2007 Average |
| Aeromonas | cfu/100 ml |
0.002 (0-0.2) |
| Cryptosporidium | oocysts per 100L |
0.06^ |
| Giardia | cysts per 100L |
0.05 |
| NDMA | ng/L |
1.4* |
KEY: ng/L=nanograms per liter (parts per trillion). ^Proposed treatment threshold is 1 oocyst per 100 liters. *The DEP “guidance value” is 10 ng/L |
||
DRINKING WATER AND PEOPLE WITH WEAKENED IMMUNE SYSTEMS
Some people may be more vulnerable to contaminants in drinking water than the general population. Immuno-compromised persons such as persons with cancer undergoing chemotherapy, persons who have undergone organ transplants, people with HIV/AIDS or other immune system disorders, some elderly, and
infants can be particularly at risk from infections. These people should seek
advice about drinking water from their health care providers. EPA/CDC guidelines on appropriate means to lessen the risk of infection by Cryptosporidium and other microbial contaminants are available from the EPA's Safe Drinking Water Hotline (1-800-426-4791).
FOR FURTHER INFORMATION |
||
|---|---|---|
| Massachusetts Water Resources Authority (MWRA) | 617-242-5323
|
|
| Massachusetts Department of Environmental Protection (DEP) | 617-292-5500 |
|
| Department of Conservation and Recreation (DCR) | 617-626-1250
|
|
| Massachusetts Department of Public Health (DPH) | 617-624-6000
|
|
| US Centers for Disease Control and Prevention (CDC) | 800-232-4636
|
|
| List of State Certified Water Quality Testing Labs | 617-242-5323
|
|
| Source Water Assessment and Protection Report (MWRA) |
617-242-5323 |
|
Information on Cross Connections |
617-242-5323 |
|
Public Meetings |
||
| MWRA Board of Directors | 617-788-1117 |
|
| MWRA Advisory Board | 617-742-7561 |
|
| Water Supply Citizens Advisory Committee | 413-586-8861 |
|
|
SHARE YOUR THOUGHTS.
If you have comments or questions about this report, please contact us.
Email joshua.das@mwra.state.ma.us, call (617) 242-5323, or send a letter to: MASSACHUSETTS WATER RESOURCES AUTHORITY, CHARLESTOWN NAVY YARD, BUILDING 39, BOSTON, MA 02129.
PDF files on this site require Adobe Acrobat Reader® (Free download.)
Updated December 15, 2009