| Home |
| Water System |
| Sewer System |
| Harbor and Bay |
| School Program |
| About MWRA |
| Doing Business with MWRA |
| Contact MWRA |
MWRA's Drinking Water Test Results for 2006
Massachusetts Water Resources Authority
CHICOPEE VALLEY Edition - html
YOUR DRINKING WATER FROM THE RESERVOIR TO YOUR GLASS
|
This report is required under the federal Safe Drinking Water Act Public Law 104-12, Section 1414 (C), PWS ID #6000000
EXECUTIVE DIRECTOR'S LETTER
Dear Customer,
The Massachusetts Water Resources Authority is pleased to send you the annual report on your drinking water quality. The report describes the journey the water takes from the reservoir to your tap and contains other important information regarding the water we deliver to your home.
Under strict federal and state guidelines, the MWRA and your local water department take many water quality samples each week. The results for 2006 are excellent. Of the 120 contaminants we test for each year, MWRA met every standard. Simply put, MWRA’s water is top quality.
MWRA and your local water department have continually improved the Chicopee Valley system. Construction continues on a parallel pipeline project to provide redundancy and reliable delivery.
Future projects include treatment improvements to meet recent changes in regulations. These advances will ensure the safe and dependable supply of top quality water for future generations.
Conservation in the MWRA service area is paying off. Demand has dropped and water usage is lower than it has been in over 20 years. But, there is still more work to be done. On average each person still uses about 65 gallons of water each day. There are many simple ways you can conserve water, including: fixing leaks, installing low-flush toilets and low-flow shower heads, or minimizing your
outdoor watering. To find out more, contact the MWRA at 617-242-SAVE or visit our website.
Remember, water is a precious resource. I hope you will take a few moments to read this report. The Board of Directors and the men and women of the MWRA take pride in being the stewards of one of the greatest water systems in the country. We want you to have confidence we have in the water we deliver to over 2 million customers. Please contact us if you have any questions or comments about your water quality, or any of MWRA's programs.
Sincerely,
Frederick A. Laskey
|
WHERE DOES YOUR WATER COME FROM?
MWRA supplies about 10 million gallons of high quality water each day to three Chicopee Valley communities: Chicopee, Wilbraham, and South Hadley Fire District #1 (FD#1). MWRA also serves 47 cities and towns in greater Boston and MetroWest.
Your water comes from Quabbin Reservoir. Water from Ware River can add to the supply at times. Rain and snow falling on the watersheds – protected land around the reservoirs – turn into streams that flow to the reservoirs. Water comes in contact with soil, rock, plants, and other material as it follows nature’s path to the reservoir. While this process helps clean the water, it can also dissolve and carry very small amounts of material in the reservoir. Minerals from soil and rock do not usually cause problems in the water. But, water can also transport contaminants from human and animal activity. These can include bacteria, viruses, pesticides and fertilizers–some of which can cause illness. The test results in this report show that these are not a problem in Quabbin Reservoir’s watershed.
The Quabbin watershed is protected naturally with over 90% of the watershed covered in forest and wetlands. About 83% of the total watershed land cannot be developed. The natural undeveloped watershed helps to keep MWRA water clean and clear. Also, to ensure safety, the streams and the reservoir are tested often and patrolled daily by the Department of Conservation and Recreation (DCR). The Department of Environmental Protection (DEP) has prepared a Source Water Assessment Program Report for the Quabbin and Wachusett Reservoirs. The report notes that wildlife (birds and aquatic animals), agriculture, transportation corridors, transmission lines, and residential land use are the key issues in the watershed.
The DEP report commends DCR and MWRA on the existing source protection plans, and states that our “watershed protection programs are very successful and greatly reduce the actual risk of contamination.” The report recommends that DCR and MWRA maintain present watershed plans and continue to work with the residents, farmers, and other interested parties to maintain the pristine watershed areas.
The Department of Environmental Protection (DEP) has prepared a Source Water Assessment Program report for the Quabbin and Wachusett Reservoirs. The report notes that wildlife (birds and aquatic animals), agriculture, transportation corridors, transmission lines, and residential land use are the key issues in the watershed. The DEP report commends DCR and MWRA on the existing source protection plans,and states that our “watershed protection programs are very successful and greatly reduce the actual risk of contamination.” The report recommends that we maintain present watershed plans and continue to work with the residents, farmers, and other interested parties to preserve the pristine watershed areas.
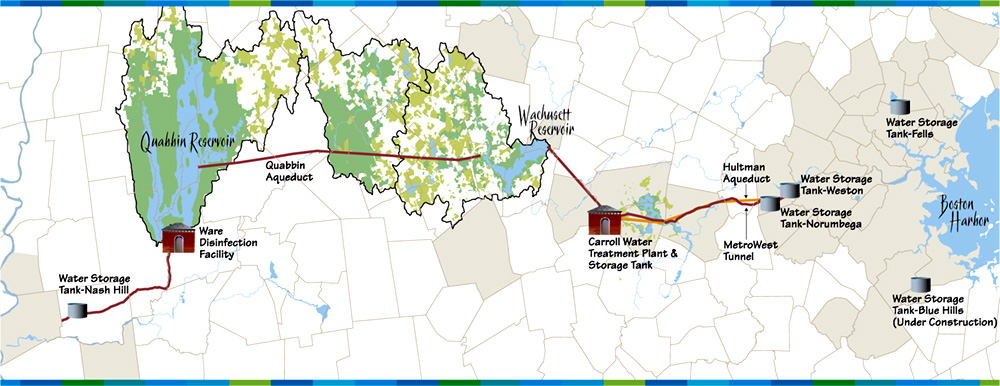
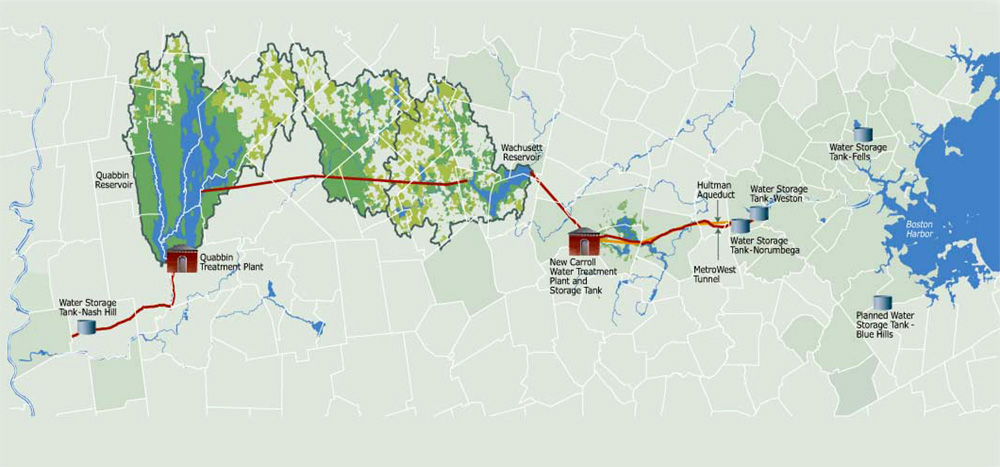
MAP OF THE MWRA WATER SYSTEM
IMPROVEMENTS TO THE WATER SYSTEM
Water must travel through the 15-mile Chicopee Valley Aqueduct and through some of the hundreds of miles of local distribution pipes and under your streets before it reaches your tap. To continue providing high quality water, each part of the water system needs routine maintenance, and, when necessary, improvements or new facilities.
|
MWRA Improvements
- The covered Nash Hill Storage Tanks were completed in June 1999 to replace the Nash Hill open reservoir. These tanks help to lessen the risk that contamination will get into your tap water.
- The Ware Treatment Facility was completed in the summer of 2001. This facility provides more efficient disinfection for your water.
- In 2005, on-line water quality monitoring was added at Nash Hill to ensure better monitoring of the water supply. Also, construction continued on the two-year Pipeline Redundancy Project in both South Hadley and Chicopee.
CHICOPEE Improvements
- In 2006, the Chicopee Water Department continued work on improvements to the distribution system by installing approximately 1,500 feet of 12- inch ductile iron pipe in the Willimansett Heights section of the city. The entire project was designed and installed in house by Chicopee Water Department employees and was laid primarily on Arlmont Street and Old Dale Street. The new ductile iron pipe replaces a 16-inch cast iron pipe that has remained in service since the early 1930s. The new main will ensure improved water quality, improved fire protection (with the addition of 4 new fire hydrants) and a more reliable source of water to the Willimansett Heights area.
- Last spring also saw the dismantling of the Sheridan Street Elevated Storage Tank that has been out of service since the late 1980s.
- During 2006, Chicopee Water Department personnel repaired a total of 61 leaks on pipes. Of the 61 leaks, 31 were house/business services, 24 were water mains/valves and 6 were hydrants damaged by motor vehicles.
WILBRAHAM Improvements
|
- During 2006, the list of duties performed by the Water Division personnel included: 3 water breaks repaired, 8 new water service installations, the replacement of two fire hydrants damaged by motorcycle accidents, 213 work orders of various tasks, 7 frozen water pipes thawed, 96 testable backflow prevention devices tested, over 350 water quality samples, and 3,292 meters were read in March and September.
- Total water usage in 2006 was 397,474,000 gallons, approximately 23 million gallons less than 2006.
- The Cottage Avenue Bridge was closed in 2005 and remained closed until November 2006. While under structural construction, the two water transmission mains and their supporting structures on the bridge were evaluated by a consultant. These two mains supply all of Wilbraham’s water needs with water coming from the Quabbin Reservoir. The recommendation was to replace the 10-inch water main and its supports, which date back to 1939. Due to extensive corrosion, the construction company completely removed the iron and wood supporting structures and new stainless steel supports were installed. The new water main is ductile iron pipe and the size was increased to 12-inches. The size increase will allow either main to handle water needs in the winter.
- There was also new 12-inch valve installed underground the Ludlow side of the bridge. The 16-inch water main had its weather proofing upgraded and new insulation and galvanized shroud installed on the coupling collars.
SOUTH HADLEY FIRE DISTRICT NO. 1 Improvements
- As part of our persistent dedication to improving the distribution system, approximately 1,400 feet of water main have been replaced within the District in the past year. The District’s maintenance staff replaced 400 feet of 6-inch A.C. pipe with 6-inch C-900 PVC pipe on Lakeview Ave, 500 feet of 8-inch A.C. pipe with 8-inch ductile iron pipe on a portion of Vivianni Street and 500 feet of 8-inch A.C. pipe with 8-inch ductile iron pipe on Linden Street. The new mains will ensure reliability of supply, flow for fire protection and improved water quality.
- In addition to the new mains, the District repaired 6 water main breaks.
- The District has also implemented a Geographical Information System (GIS) to update and modernize District’s distribution system mapping.
TESTING YOUR WATER EVERY STEP OF THE WAY
Tests before treatment
We test the water as it leaves the reservoir to see how well protected our watersheds are. Test results show that few contaminants are found in the reservoir water. The few that are found are in very small amounts, well below EPA’s standards.
Turbidity (or cloudiness of water) is one measure of overall water quality. Typical levels at the Wachusett Reservoir are 0.4 NTU (Nephelometric
Turbidity Units). In 2006, turbidity was always below both EPA’s standard of 5.0 NTU and the stricter Massachusetts standard of 1.0 NTU, with the highest level at 0.85 NTU.
MWRA also tests reservoir water for pathogens - such as fecal coliform, bacteria, viruses, and the parasites Cryptosporidium and Giardia. They can enter the water from animal or human waste. All test results were well within state and federal testing and treatment standards.
Tests after treatment
EPA and state regulations also require many water quality tests after treatment to check the water you are drinking. MWRA follows - and even goes beyond - these tests. We conduct tens of thousands of tests per year. The testing allows us to better monitor your water.
Tests in community pipes
MWRA and local water departments work together to test water all the way to the tap. We test samples of water in the city and town systems each week for total coliform bacteria. Total coliform bacteria can come from the intestines of warm blooded animals, or can be found in soil, plants, or other places. Most of the time, these bacteria are not harmful. However, their presence could signal that harmful bacteria from fecal waste may be there as well. The EPA requires that no more than 5% of the samples in a given month may be positive for total coliform. If a water sample tests positive for total coliform, we run more specific tests for E.coli. E.coli is a pathogen found in human and animal fecal waste that can cause illness.
QUABBIN RESERVOIR WATER TEST RESULTS - AFTER TREATMENT (cva) |
|||||||
Compound |
Units |
(MCL) Highest Level Allowed |
(We found) Detected Level, Average |
Range of Detections |
(MCLG) Ideal Goal |
Violation |
How it gets in the water |
| Barium | ppm | 2 |
0.007 |
0.007-0.008 |
2 |
No | Common mineral in nature |
| Nitrate | ppm | 10 |
0.02 |
0.07-0.02 |
10 |
No | Natural deposits |
KEY: MCL=Maximum Contaminant Level - The highest level of a contaminant allowed in water. MCLs are set as close to the MCLGs as feasible using the best available technology. MCLG= Maximum Contaminant Level Goal - The level of contaminant in drinking water below which there is no known or expected risk to health. MCLGs allow for a margin of safety. MRDL = Maximum Residual Disinfectant Level - The highest level of a disinfectant allowed in drinking water. There is convincing evidence that addition of a disinfectant is necessary for control of microbial contaminants. MRDLG=Maximum Residual Disinfectant Goal - The Level of a drinking water disinfectant below which there is no known or expected health risk. MRDLGs do not reflect the benefits of use of disinfectants to control microbial contamination. ppm = parts per million. ppb = parts per billion. Avg = Average. |
|||||||
How did we do in 2006?
No bacteria were found in any CVA community system in 2006.
WATER TREATMENT - FROM THE RESERVOIR TO COMMUNITY PIPELINES
|
Because of its excellent watershed conditions and protection, Quabbin Reservoir does not need a filtration step in its treatment. The state Department of Environmental Protection set special conditions in 1991 to maintain Quabbin's high quality water.
But, even high quality water must be properly treated. MWRA's licensed treatment operators treat water at the reservoir before it enters the Chicopee Valley Aqueduct. The first treatment step is the primary disinfection where MWRA’s licensed operators carefully add measured doses of chlorine to water to kill pathogens that may be present. Licensed operators from CVA communities perform additional booster disinfection at the point where the local pipes take water from the Aqueduct. This process, called residual disinfection, protects the water while in the local pipes. Each community also treats the water to reduce leaching of lead and copper from home plumbing.
CHICOPEE WATER DEPARTMENT – Improvements
The Chicopee Water Treatment Plant continues to add sodium carbonate and sodium bicarbonate (baking soda) to increase the pH and alkalinity of its drinking water. This adjustment, along with the addition of a phosphate blend, further reduces lead and copper in the water. This treatment has proven to be very effective in reducing the corrosion of both the city’s water mains and home plumbing. Red water problems (from iron water mains) and green staining of plumbing fixtures (from copper in home plumbing) have been eliminated with these treatment processes as well.
In 2006, there were 120 samples collected for the analysis of lead and copper in Chicopee’s drinking water. These samples were collected from homes throughout the city. This year, EPA will require Chicopee to collect just 30 samples to be analyzed for lead and copper. The number of samples required has been greatly reduced due to the outstanding results of low to absent levels of lead and copper in the drinking water. The recent replacement of Chicopee’s SCADA (Supervisory Control and Data Acquisition) computer system has allowed more accurate and reliable monitoring of its treatment processes. This new computer and its software will also permit upgrades to essential equipment at the treatment plant and related remote sites in the future.
WILBRAHAM – Improvements
The Water Department’s Corrosion Control Program (CCP) implemented in 1997 continues to operate very well. The effectiveness of our CCP is determined by lead and copper sampling analysis. Prior to 2006, the Water Division was on reduced monitoring which required sampling 15 sites within the distribution system for lead and copper levels every three years. In January 2006, DEP surprised the Water Division by requiring two full rounds (88 samples) of lead and copper sampling be accomplished in 2006. Both sampling rounds were completed during 2006 with excellent results, indicating our Corrosion Control Program is working flawlessly.
SOUTH HADLEY FIRE DISTRICT #1 – Improvements
The District has completed our $1.1 million dollar upgrade to our Ludlow Facility. The project consists of a new booster pump, building improvements, and a permanent Sodium Silicate corrosion control system. Unfortunately during construction the District’s corrosion control was compromised due to power failure, pump failure, etc. The direct result of these issues was that our first round of lead and copper sample results were above DEP’s lead requirements. Once our new corrosion control system was on-line, we monitored water quality monthly and adjusted our dosage based on those results to optimize the distribution system in order to restore the system to the parameters prior to construction. We subsequently took another round of samples and are pleased to inform our ratepayers that our round of lead and copper samples in November were back under DEP standards.
WHAT YOU SHOULD KNOW ABOUT LEAD
MWRA and local pipes that carry the water to your community are made of concrete, iron and steel, and do not add lead to water. However, lead can get into tap water through pipes in your home, your lead service line, lead solder used in plumbing, and some brass fixtures. Corrosion or wearing away of lead- based materials can add lead to tap water, especially if water sits for a long time in the pipes before it is used.
What Are We Doing About Lead?
Your local water department tests tap water at a number of homes in the communities. But not just any homes. Under Environmental Protection Agency regulations, homes that are likely to have high lead levels – usually older homes likely to have lead service lines or lead solder – must be tested. The EPA rule requires that 9 out of 10, or 90%, of these sampled homes must have lead levels below the Action Level of 15 parts per billion (ppb).
Lead levels found in tap water in sampled homes dropped significantly since the CVA communities improved treatment to make the water less corrosive. This means the water is less likely to absorb lead from pipes and other fixtures. Due to interruption of corrosion control, South Hadley Fire District was above the Action Level for Lead of 15 ppb for first sampling round in 2006, with a 90th percentile value of 35 ppb. After this sampling round, corrosion control dosage was analyzed and adjusted. The results of the next two sampling rounds in 2006 were below the Action Level, and preliminary results for 2007 are also below the Action Level. Both Chicopee and Wilbraham were below the lead Action Level for both sampling rounds in 2006.
LOCAL TEST RESULTS FOR 2006
What do these tables tell me?
These tables list results for lead, copper, sodium, and disinfection by-products, including trihalomethanes and haloacetic acids, for Chicopee, South Hadley Fire District #1, Wilbraham and Westover Air Force Base.
All results for lead, copper, sodium and disinfection by-products were IN COMPLIANCE with drinking water regulations.
GO TO RESULTS FOR:
Chicopee | South Hadley Fire District #1 | Wilbraham | Westover Air Force Base
Total Trihalomethanes (TTHMs) in ppb |
Annual Average = 39.9 Range = 30.1 - 44.9 |
|
| Haloacetic Acids (HAA5) in ppb MCL = 60 ppb, MCLG = 0 |
Annual Average = 31.5 Range = 13.6 - 37.6 |
|
| Lead in ppb AL of 15 ppb, MCLG=0 |
# Samples over AL = 1 of 60 90% Value = 2.9 |
|
| Copper in ppm AL of 1.3 ppm , MCLG = 1.3 ppm |
# Samples over AL = 0 of 60 90% Value = 1.7 |
|
| Chlorine in ppm MRDL - 4ppm avg, MRDL = 4 ppm |
Annual Average = 0.68 Range = 0.008 - 1.2 |
|
| Sodium in ppm | 13.75 | |
| AL = Action Level: The concentration of a contaminant which, if exceeded, triggers treatment or other requirements which a water system must follow. MCLG = Maximum Contaminant Level Goal - The level of a contaminant in drinking water below which there is no known or expected risk to health. MCLGs allow for a margin of safety. Avg = Average | ||
Total Trihalomethanes (TTHMs) in ppb |
Annual Average = 49 Range = 30 - 61.1 |
|
| Haloacetic Acids (HAA5) in ppb MCL = 60 ppb, MCLG = 0 |
Annual Average = 20.2 Range = 1.7 - 33.2 |
|
| Lead in ppb AL of 15 ppb, MCLG=0 |
# Samples over AL = 5 of 60 90% Value = 14.8 |
|
| Copper in ppm AL of 1.3 ppm , MCLG = 1.3 ppm |
# Samples over AL = 0 of 60 90% Value = 0.3 |
|
| Chlorine in ppm MRDL - 4ppm avg, MRDL = 4 ppm |
Annual Average = 0.3 Range = 0.05 - 0.7 |
|
| Sodium in ppm | 5.8 | |
| AL = Action Level: The concentration of a contaminant which, if exceeded, triggers treatment or other requirements which a water system must follow. MCLG = Maximum Contaminant Level Goal - The level of a contaminant in drinking water below which there is no known or expected risk to health. MCLGs allow for a margin of safety. Avg = Average | ||
Total Trihalomethanes (TTHMs) in ppb |
Annual Average = 45.5 Range = 28.9-53.5 |
|
| Haloacetic Acids (HAA5) in ppb MCL = 60 ppb, MCLG = 0 |
Annual Average = 21.6 Range = 1-33.3 |
|
| Lead in ppb AL of 15 ppb, MCLG=0 |
# Samples over AL = 1 of 40 90% Value = 5.7 |
|
| Copper in ppm AL of 1.3 ppm , MCLG = 1.3 ppm |
# Samples over AL = 0 of 40 90% Value = 0.48 |
|
| Chlorine in ppm MRDL - 4ppm avg, MRDL = 4 ppm |
Annual Average = 0.3 Range = 0.2-0.7 |
|
| Sodium in ppm | 6 | |
| AL = Action Level: The concentration of a contaminant which, if exceeded, triggers treatment or other requirements which a water system must follow. MCLG = Maximum Contaminant Level Goal - The level of a contaminant in drinking water below which there is no known or expected risk to health. MCLGs allow for a margin of safety. Avg = Average | ||
Total Trihalomethanes (TTHMs) in ppb |
Annual Average = 32.1 Range = 29.5-33.4 |
|
| Haloacetic Acids (HAA5) in ppb MCL = 60 ppb, MCLG = 0 |
Annual Average = 39.5 Range = 1.7 - 33.2 |
|
| Lead in ppb AL of 15 ppb, MCLG=0 |
# Samples over AL = 5 of 60 90% Value = 12.4-56.3 |
|
| Copper in ppm AL of 1.3 ppm , MCLG = 1.3 ppm |
# Samples over AL = 0 of 10 90% Value = 0.46 |
|
| Chlorine in ppm MRDL - 4ppm avg, MRDL = 4 ppm |
Annual Average = 0.57 Range = 0.2-1.02 |
|
| Sodium in ppm | -- | |
| AL = Action Level: The concentration of a contaminant which, if exceeded, triggers treatment or other requirements which a water system must follow. MCLG = Maximum Contaminant Level Goal - The level of a contaminant in drinking water below which there is no known or expected risk to health. MCLGs allow for a margin of safety. Avg = Average | ||
WHAT CAN I DO TO REDUCE MY EXPOSURE TO LEAD?
- Be careful of places you find lead in or near your home. Paint, soil, dust, and some pottery may contain lead.
- Run the tap until after the water feels cold. To save water, fill a pitcher and place in refrigerator for future use.
- Never use hot water from the faucet for drinking or cooking - especially when making baby formula or other food for infants.
- Ask your local water department if there are lead service pipes leading to your home.
- Test your tap water. Contact MWRA at 617-242-5323 or visit www.mwra.com/04water/html/testinglabs.html for more tips and a list of certified labs.
- Call the Department of Public Health at 1-800-532-9571 or EPA at 1-800-424-LEAD for health information.
IMPORTANT LEAD INFORMATION FROM EPA
INFANTS AND YOUNG CHILDREN ARE TYPICALLY MORE VULNERABLE TO LEAD IN DRINKING WATER THAN THE GENERAL POPULATION. It is possible that lead levels in your home may be higher than at other homes in the community as a result of materials used in your home’s plumbing. Infants and children who drink water containing lead in excess of the action level could experience delays in their physical or mental development. Children could show slight deficits in attention span and learning abilities. Adults who drink this water over many years could develop kidney problems or high blood pressure. If you are concerned about elevated lead levels in your home’s water, you may wish to have your water tested and flush your tap until after it is cold before using tap water.
IMPORTANT INFORMATION FROM EPA AND DEP
DRINKING WATER AND PEOPLE WITH WEAKENED IMMUNE SYSTEMS:
Some people may be more vulnerable to contaminants in drinking water than the general population. Immuno-compromised persons such as persons with cancer undergoing chemotherapy, persons who have undergone organ transplants, people with HIV/AIDS or other immune system disorders, some elderly, and infants can be particularly at risk from infections. These people should seek advice about drinking water from their health care providers. EPA/CDC guidelines on appropriate means to lessen the risk of infection by Cryptosporidium and other microbial contaminants are available from the Safe Drinking Water Hotline (1-800-426-4791)
CONTAMINANTS IN BOTTLED WATER AND TAP WATER:
Drinking water, including bottled water, may reasonably be expected to contain at least small amounts of some contaminants. The presence of contaminants does not necessarily indicate that water poses a health risk. More information about contaminants and potential health effects can be obtained by calling the EPA’s Safe Drinking Water Hotline (1-800-426-4791) or MWRA (617-242-5323).
In order to ensure that tap water is safe to drink, the Massachusetts DEP and EPA prescribe regulations which limit the amount of certain contaminants in water provided by public water systems. The Food and Drug Administration (FDA) and the Massachusetts Department of Public Health regulations establish limits for contaminants in bottled water which must provide the same protection for public health.
WHERE TO GO FOR FURTHER INFORMATION
WEBSITES AND PHONE NUMBERS
|
| Massachusetts Water Resources Authority (MWRA) http://www.mwra.com (617) 242-5323 |
| Massachusetts Department of Environmental Protection (DEP) http://www.mass.gov/dep (617) 292-5500 |
Massachusetts Department of Public Health (DPH) |
| Department of Recreation and Conservation (DCR) http://www.mass.gov/dcr (617) 626-1250 |
| US Centers for Disease Control & Prevention (CDC) http://www.cdc.gov (800) 311-3435 |
| List of State Certified Water Quality Testing Labs http:// www.mwra.com/water/html/qual6.htm (617) 242-5323 |
| Source Water Assessment and Protection Report http://www.mwra.com/sourcewater.htm (617) 242-5323 |
PUBLIC MEETINGS
|
| MWRA Board of Directors http://www.mwra.com/02org/html/gov.htm (617) 788-1117 |
| MWRA Advisory Board http://www.mwraadvisoryboard.com (617) 742-7561 |
| Water Supply Citizens Advisory Committee http://www.mwra.com/02org/html/wscac.htm (413) 586-8861 |
PUBLIC MEETINGS
|
| Chicopee Water Department (617) 594-3420 |
| South Hadley Fire District #1 (413) 532-0666 |
| Wilbraham (413) 596-2807 |
If you would like more in-depth information on your water quality, a monthly report is available.
Please visit our web site or call 617-242-5323. Thank you for reading this report.
WATER CONSERVATION
Water is a precious resource.
Wasting water can add up quickly. On average, a family of four uses 90,000 gallons of water each year; each person uses about 65 gallons of water each day. Consumers are discovering that more efficient water use can reduce the impact on the water supply and their wallets. Here are some ways to make your home and your habits more water efficient. For water saving ideas, call 617-242-SAVE or visit our website.
SHARE YOUR THOUGHTS.
If you have comments or questions about this report, please contact us. Email: joshua.das@mwra.state.ma.us, call (617) 242-5323, or send a letter to: MASSACHUSETTS WATER RESOURCES AUTHORITY, 100 FIRST AVENUE, BOSTON MA 02129.
Some files on this site require Adobe Acrobat Reader®. (Free download).
Updated June 8, 2007